Consider the power of incentives

But the similarity does raise a question about broad-based incentives. Assuming that hospitals that attained the highest levels on the EMRAM model were already likely to qualify for the MU Stage 1 incentives, what motivated them to continue and increase IT adoption at roughly the same rate as hospitals that needed IT adoption to receive the incentive payments?
One explanation is coincidence. Hoyt and Miliard may have chosen their data points randomly. But we can rearrange the pairings in the data differently in an attempt to see if it is possible to quantify the role of the incentives.
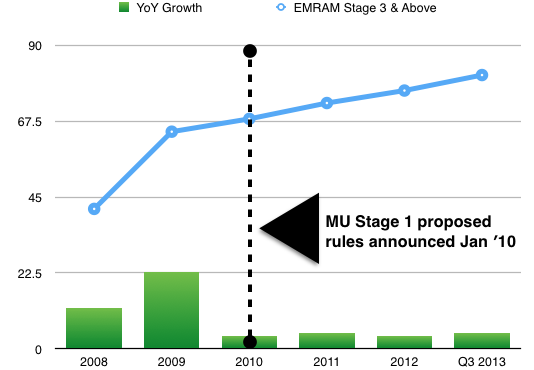
In fact, Margalit Gur-Arie has already done this. In a May 2013 "On Health Care Technology" blog post (http://onhealthtech.blogspot.com/2013/05/spinning-ehr-adoption-numbers.html), Gur-Arie placed hospitals into two groups: those in EMRAM Stages 0-2, and those in Stage 3 and above. Those in the latter group would qualify, presumably, for Stage 1 meaningful use. Those in the former group would need to invest in IT to qualify for incentive payments.

Using 2008 as a baseline – a time when hospitals wouldn’t yet know Stage 1 requirements – 41.5 percent of all hospitals fell into the EMRAM Stage 3 and above. In 2010, when the rules on Stage 1 were finalized, the percentage was already at 68 percent. By 2011, when the incentive payments first started, that percentage was at 73 percent. And by Q3 of 2013, the number had risen to 81.2 percent.
In other words, prior to even knowing what the MU Stage 1 requirements were, nearly 7 in 10 hospitals had the technology to qualify in place. In the following three years, the number had climbed to only 8 in 10 hospitals. One might well conclude that not knowing what the requirements were drove adoption (by 64%) far more dramatically than the actual requirements themselves (15%).
This doesn’t mean that the incentives weren’t effective – far from it. As Gur-Arie noted in her blog, the number of hospitals reaching EMRAM Stage 3 or better doubled, from about 40 to about 80 percent. And at least some of that can be credited to the incentives. And even more change, nor doubt, can be attributed to the looming threat of disincentives scheduled for 2015. As social scientists have demonstrated, the stick can be far more effective than the carrot at changing behavior.
[See also: Time for a new optimism.]


